Guideline
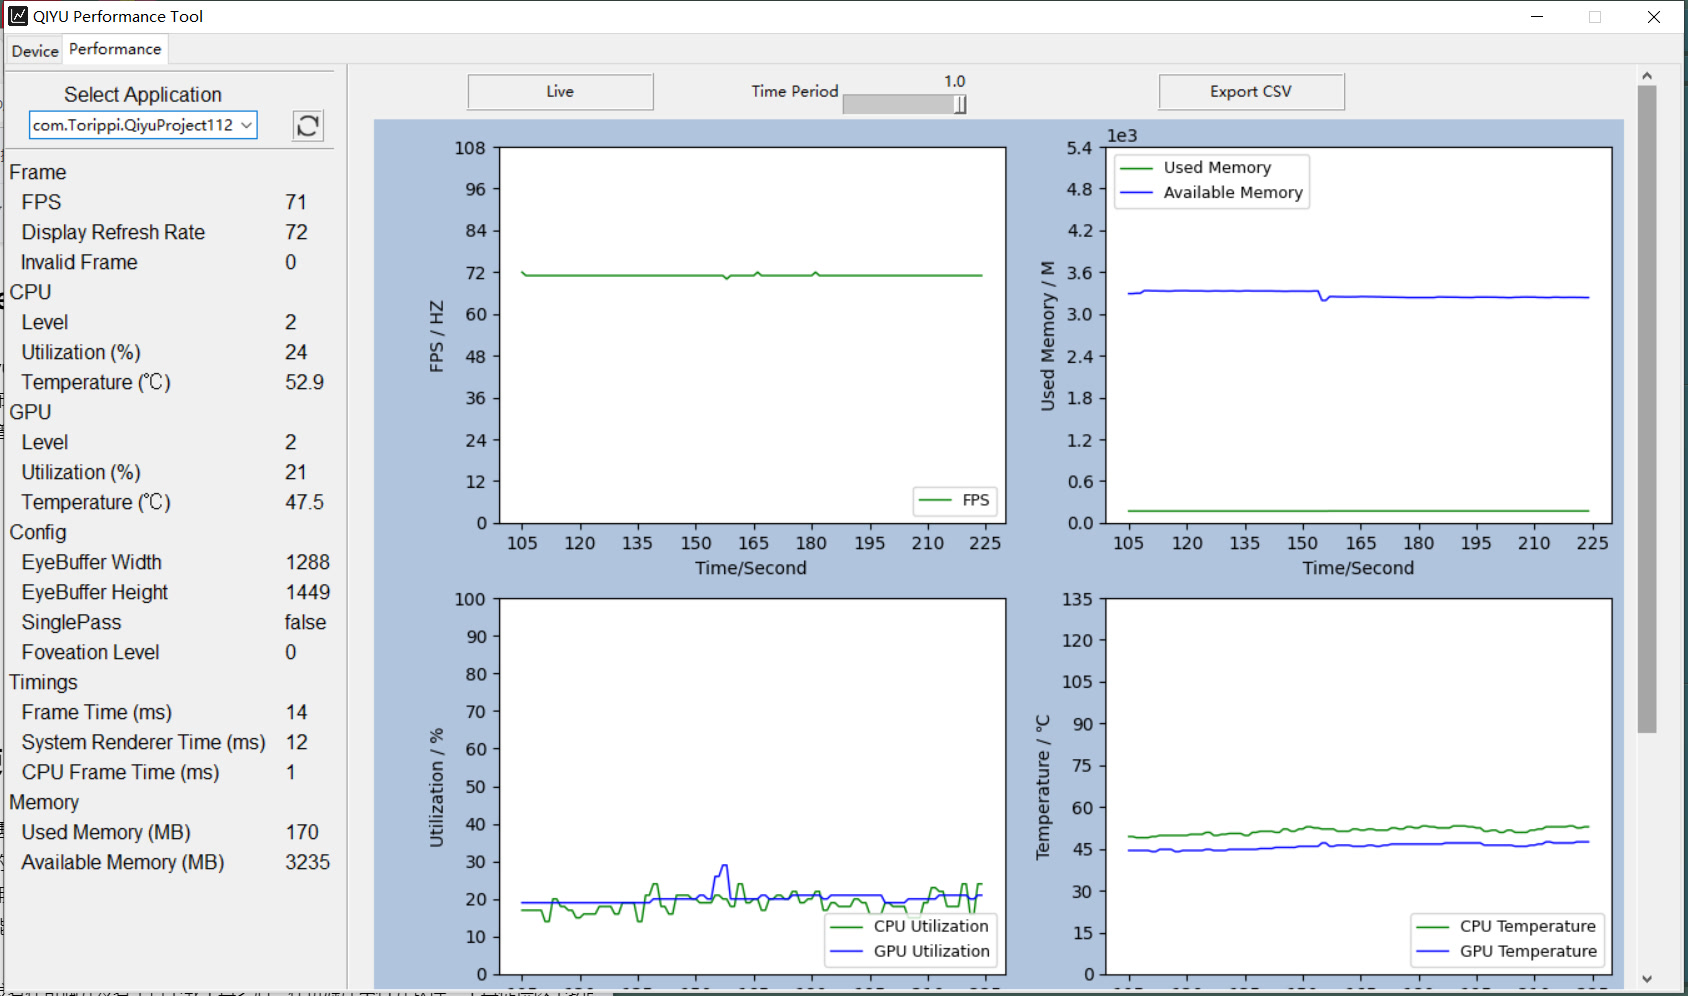
To help developers easily optimizing applications performance data and reduce the performance effects, developer can connect QIYU device with PC by using USB cable, and PC version of QIYU Performance Tool provides reference and guideline performance indicators which include FPS, Eye buffer Width and Height, Memory Utilization, GPU Utilization, CPU Utilization, Temperature, Invalid frames and other important information.
Fig1 PC performance tool Introduction
- The QIYU performance tool can be download on QIYU developer portal, and unzip the package. In Windows, you can double click the “qiyu_performance_tool.exe” to run the tool.
- Once running the PC tool and connecting QIYU device with PC by using USB cable, the tool will install the performance tool as service on headset, and enable the CSV, please do not uninstall the device service or disable the CSV.
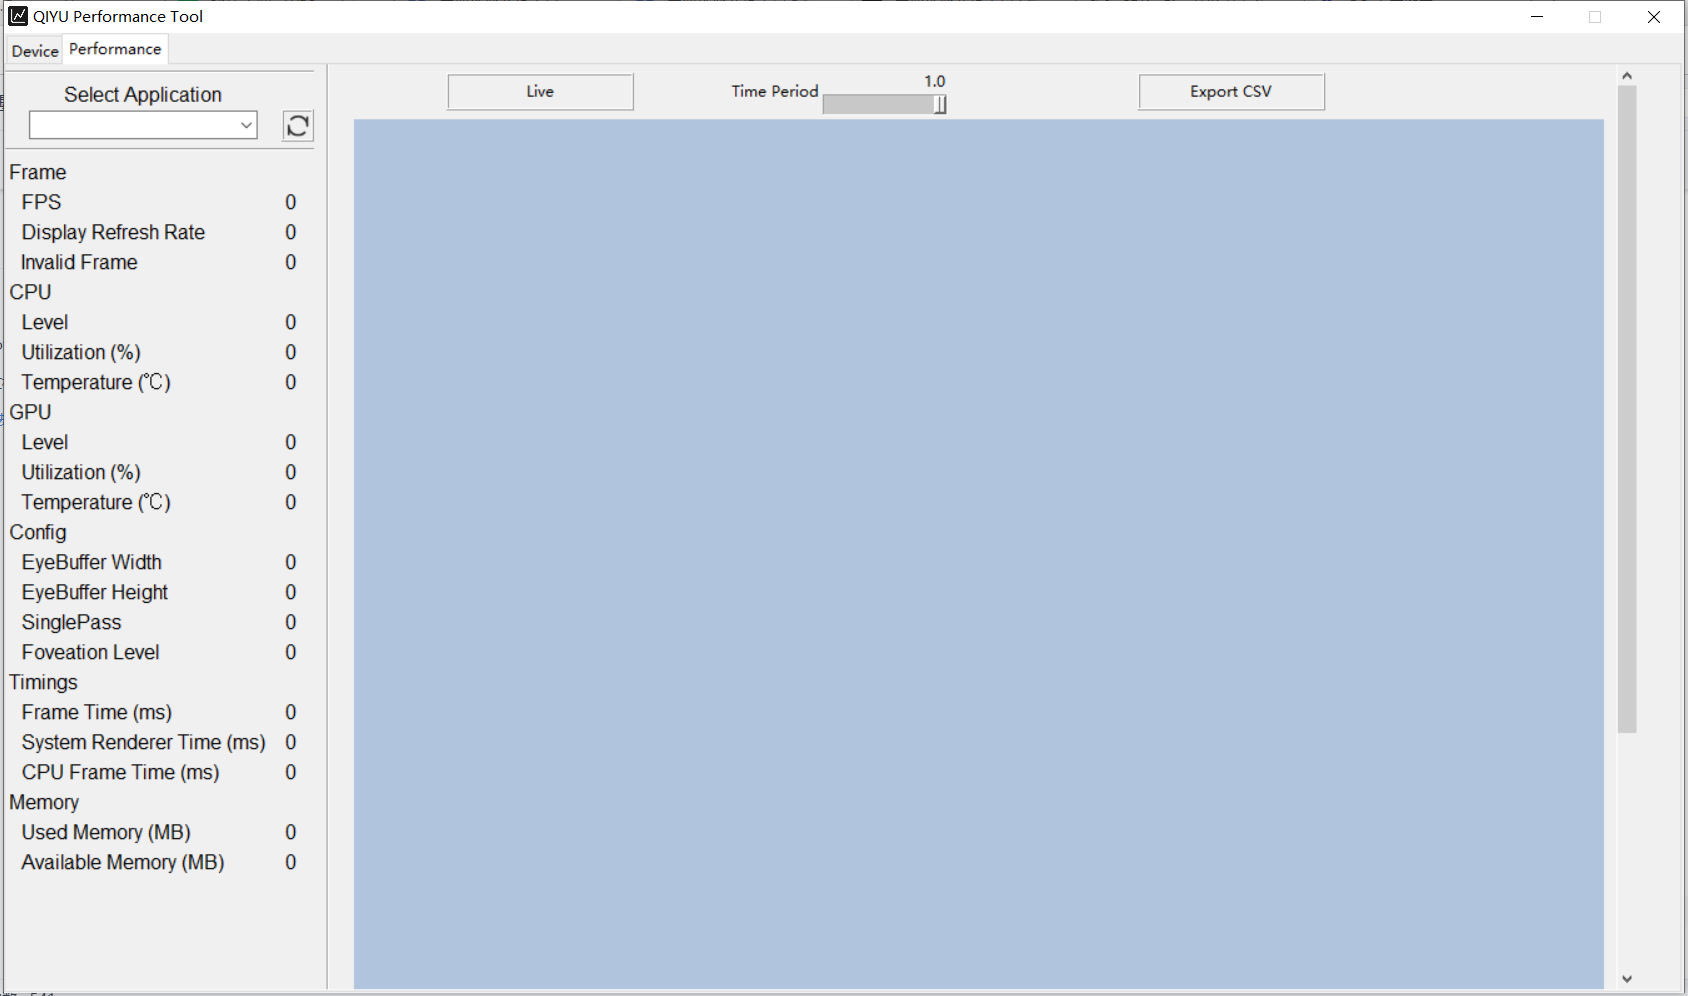
Fig2 PC Performance tool (VR application has no started) After starting the application in QIYU device and you check the real-time performance data on PC interface as shown in Figure 1.
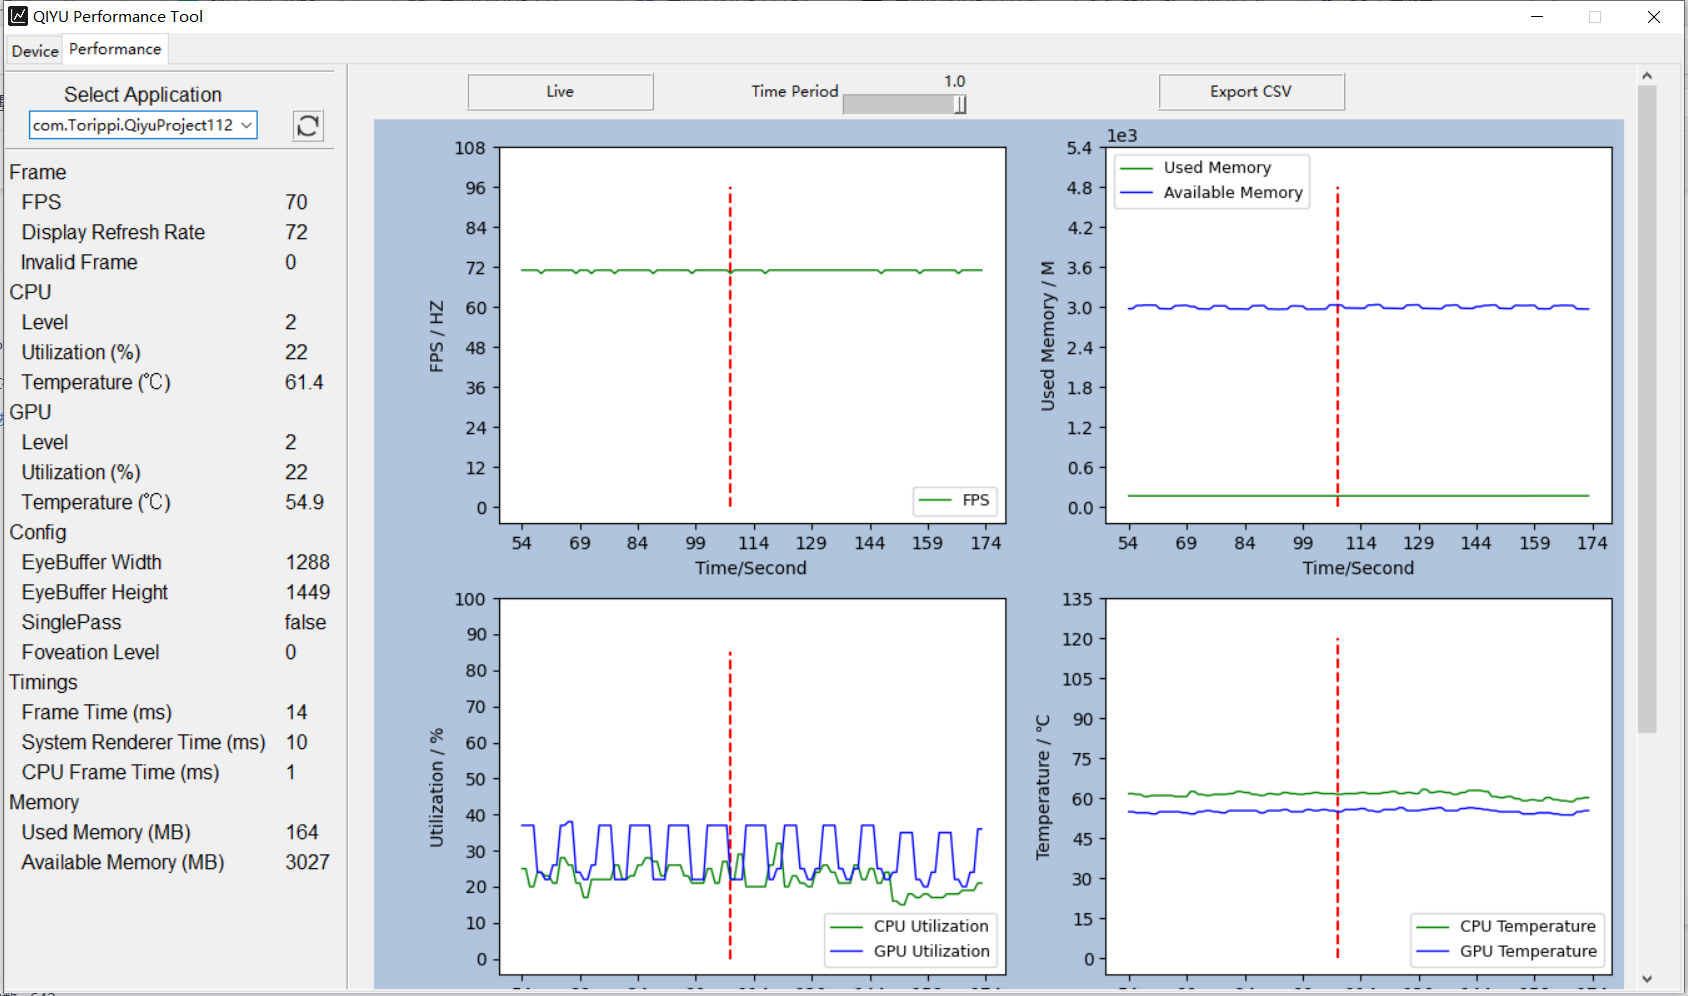
If you need to check the specific time of perfromance data, just pressing the point of on the graphic. If back to real-time graphic, just pressing "Live" button.
If you need to check the previous real-time graphics, please dragging the Time Period to where you want to check.
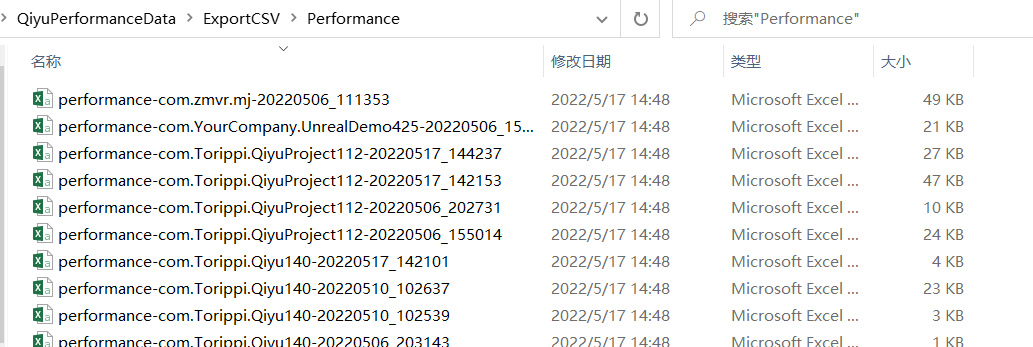
If you need to output the performance data file, pressing "Export CSV", the data will be saved at QiyuPerformanceData\ExportCSV\Performance, the file name is performance-packagename-date-time.csv.
- The history performance data of other applications can be checked by selecting the data of application list. Note: using the performance tool to monitor application, all the application will be shown in Select Application list.
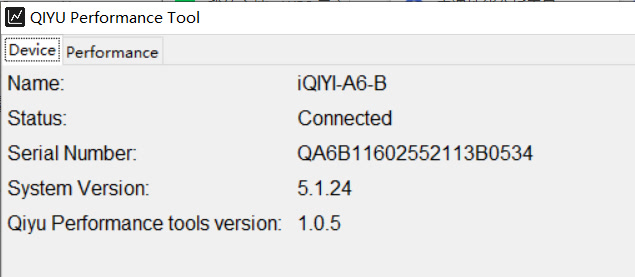
- Deivce information can be checked in Device page.
- Please delete those unnecessary performance files in QIYU device to avoid affecting the transmission efficiency, those files are saved at /sdcard/ Performance/.


